First off, this post isn’t groundbreaking exercise physiology research; it’s just numbers analysis brought to you by my friends at TrainingPeaks — they provide the software, and I provide the analysis to my teammates.
What I’ve been looking at is the power files from a recent Ironman race, one in which the athletes involved were well-trained, experienced performers at the Ironman distance:
- Athlete A, a former pro now racing as an age grouper, who won his division at the 2013 Ironman Coeur d’Alene by a pretty substantial margin.
- Athlete B, a younger age group male, who set a PR at this year’s Coeur d’Alene race and finished 11th in the most competitive division, but only 5 minutes out of 6th.
Athlete A is very new to training and racing with power — you’d call him “old school” in his training and racing methods. He’s used to racing by feel, and this has served him well over distances from sprint triathlons to Ultraman, yet he hasn’t done an Ironman run split that reflects his considerable ability as a runner. My working theory for this was that he spent just a little too much energy in the bike leg, which is his forté (though he also swims in the low- to mid-50s, so he’s not exactly a slouch there either). A couple of us on the team basically forced him to get a power meter, so with a few rides’ worth of power numbers, including a sprint triathlon the weekend before Coeur d’Alene, Based on what I could see, I guesstimated his “ride-to” power for the Ironman distance at 255W. I could tell he thought that sounded low — in a lab environment back in 2007, the analysis based on blood lactate tests done on a CompuTrainer had him pegged at 325W for Ironman power. But in trying to ride to that in a summer Ironman race, he had cooked himself by mile 70. In the meantime, we have all sorts of real-world data from the pros at Kona, the best of whom don’t even average 300W. “Try it,” was about all I could say.
His race went great, but not perfectly. He was 2nd out of the water, but started cramping and estimates that it took 20-30 minutes into the bike to fully rid himself of the leg cramps. During this time, he was passed by a number of guys and was in the for-him unusual position of having more riders around him than he was used to. Once the cramps subsided, he did some work to get back into his more usual front-of-the-pack position, and ended up coming off the bike in 1st with a 5:07 split. On the run, he was able to run sub 3:30 — something he hadn’t done in about a decade — and win the age group by a comfortable margin. Kona, baby!
So the question was, how did the power-pacing experiment go?
If we look at his TrainingPeaks file, we see a number of things:
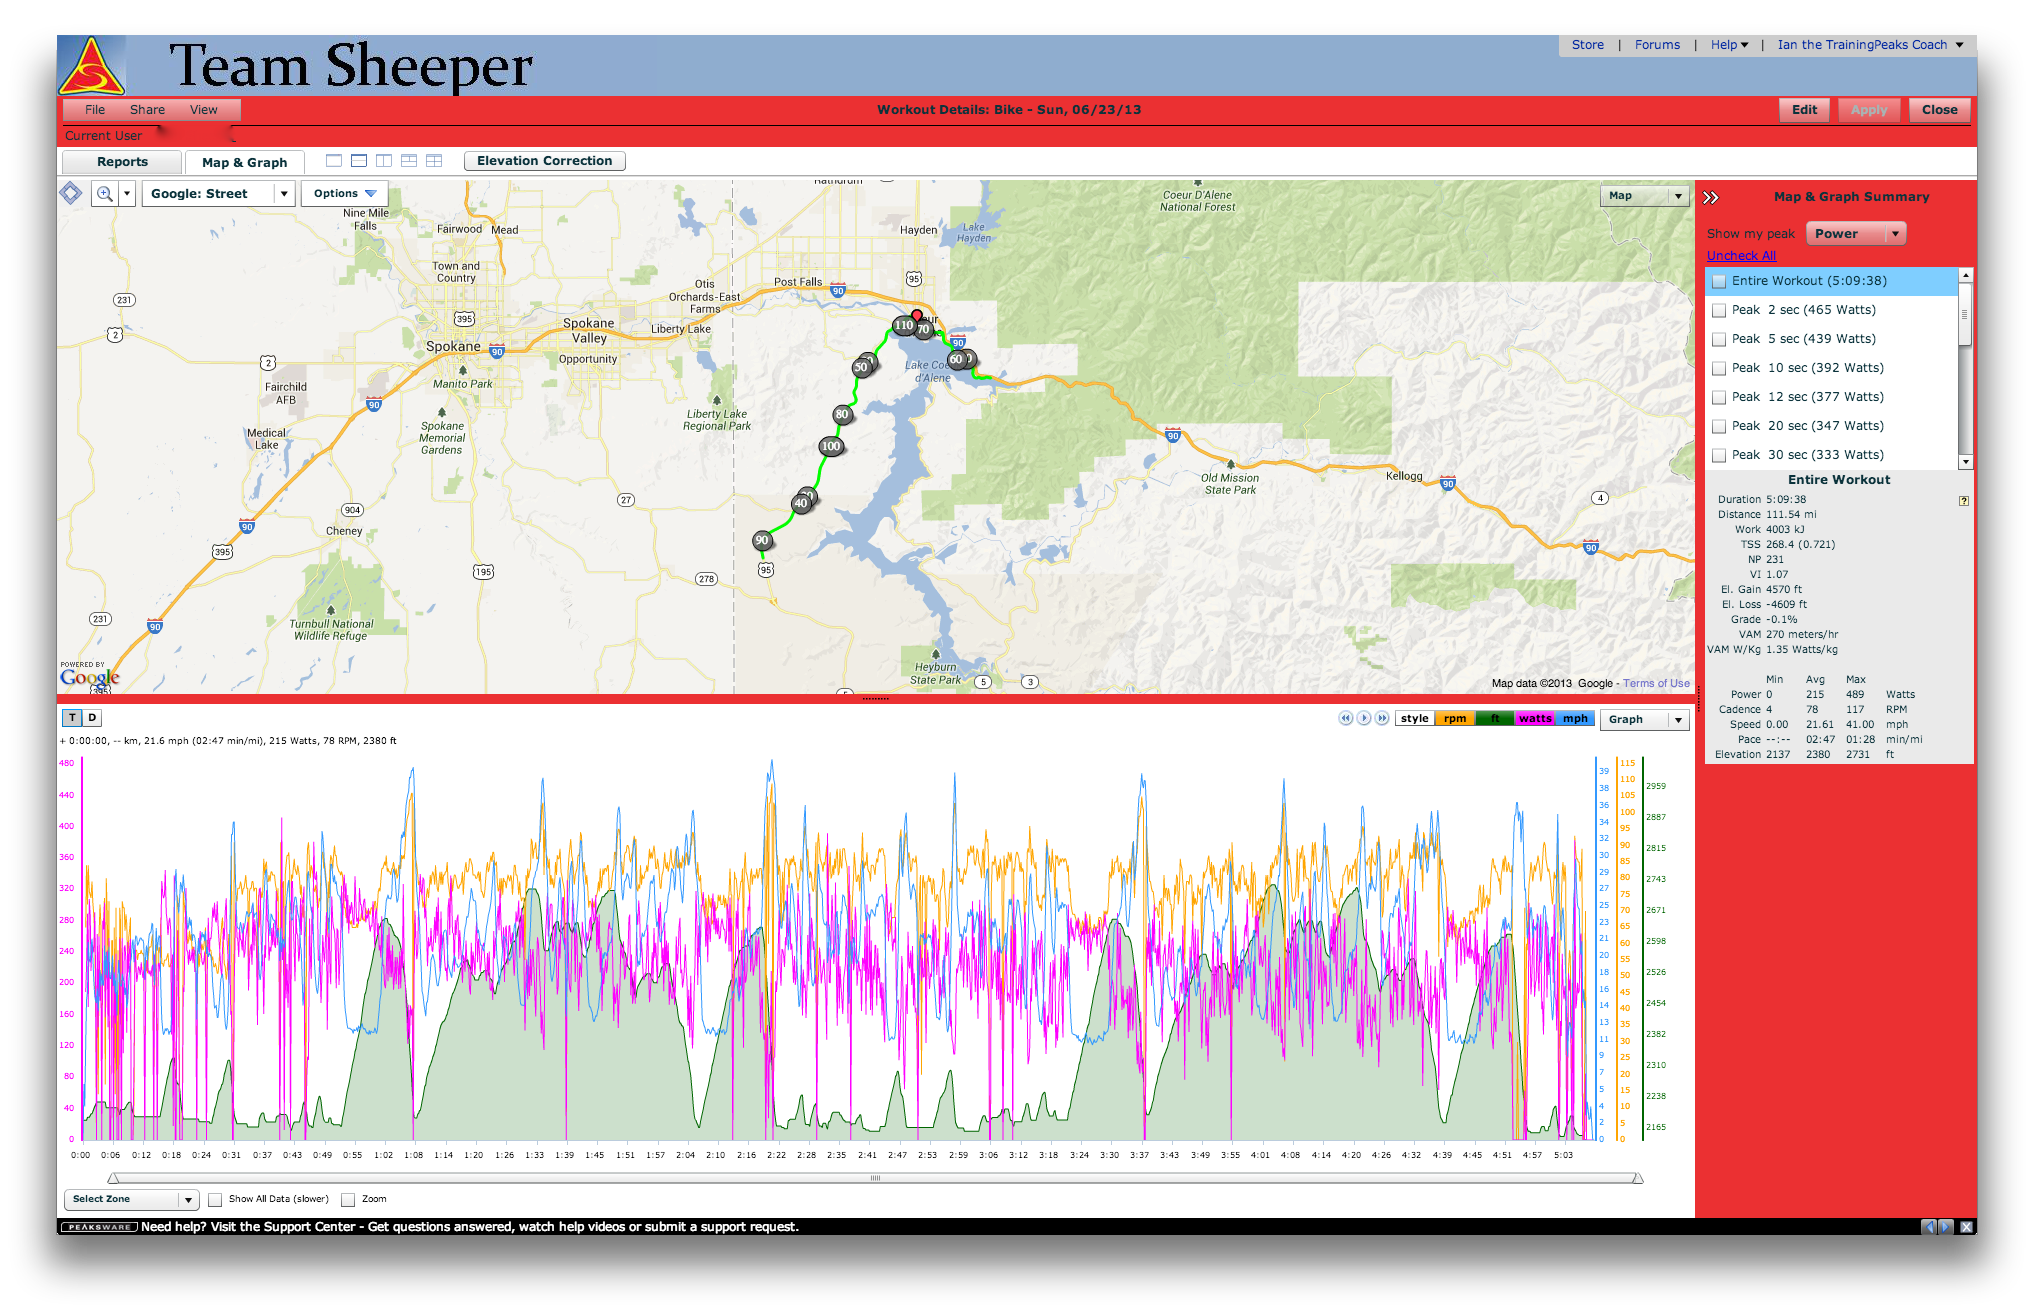
- Normalized Power of 231W — considerably under the 255W I had suggested for his ceiling.
- Variability Index of 1.07, which means he rode fairly evenly (1.00 is perfect), especially for an undulating course.
- TSS of 268 and Intensity Factor of .72, meaning he left plenty in the tank for the run (normal target TSS is 280-310; ideal IF varies according to how long the athlete takes for the ride).
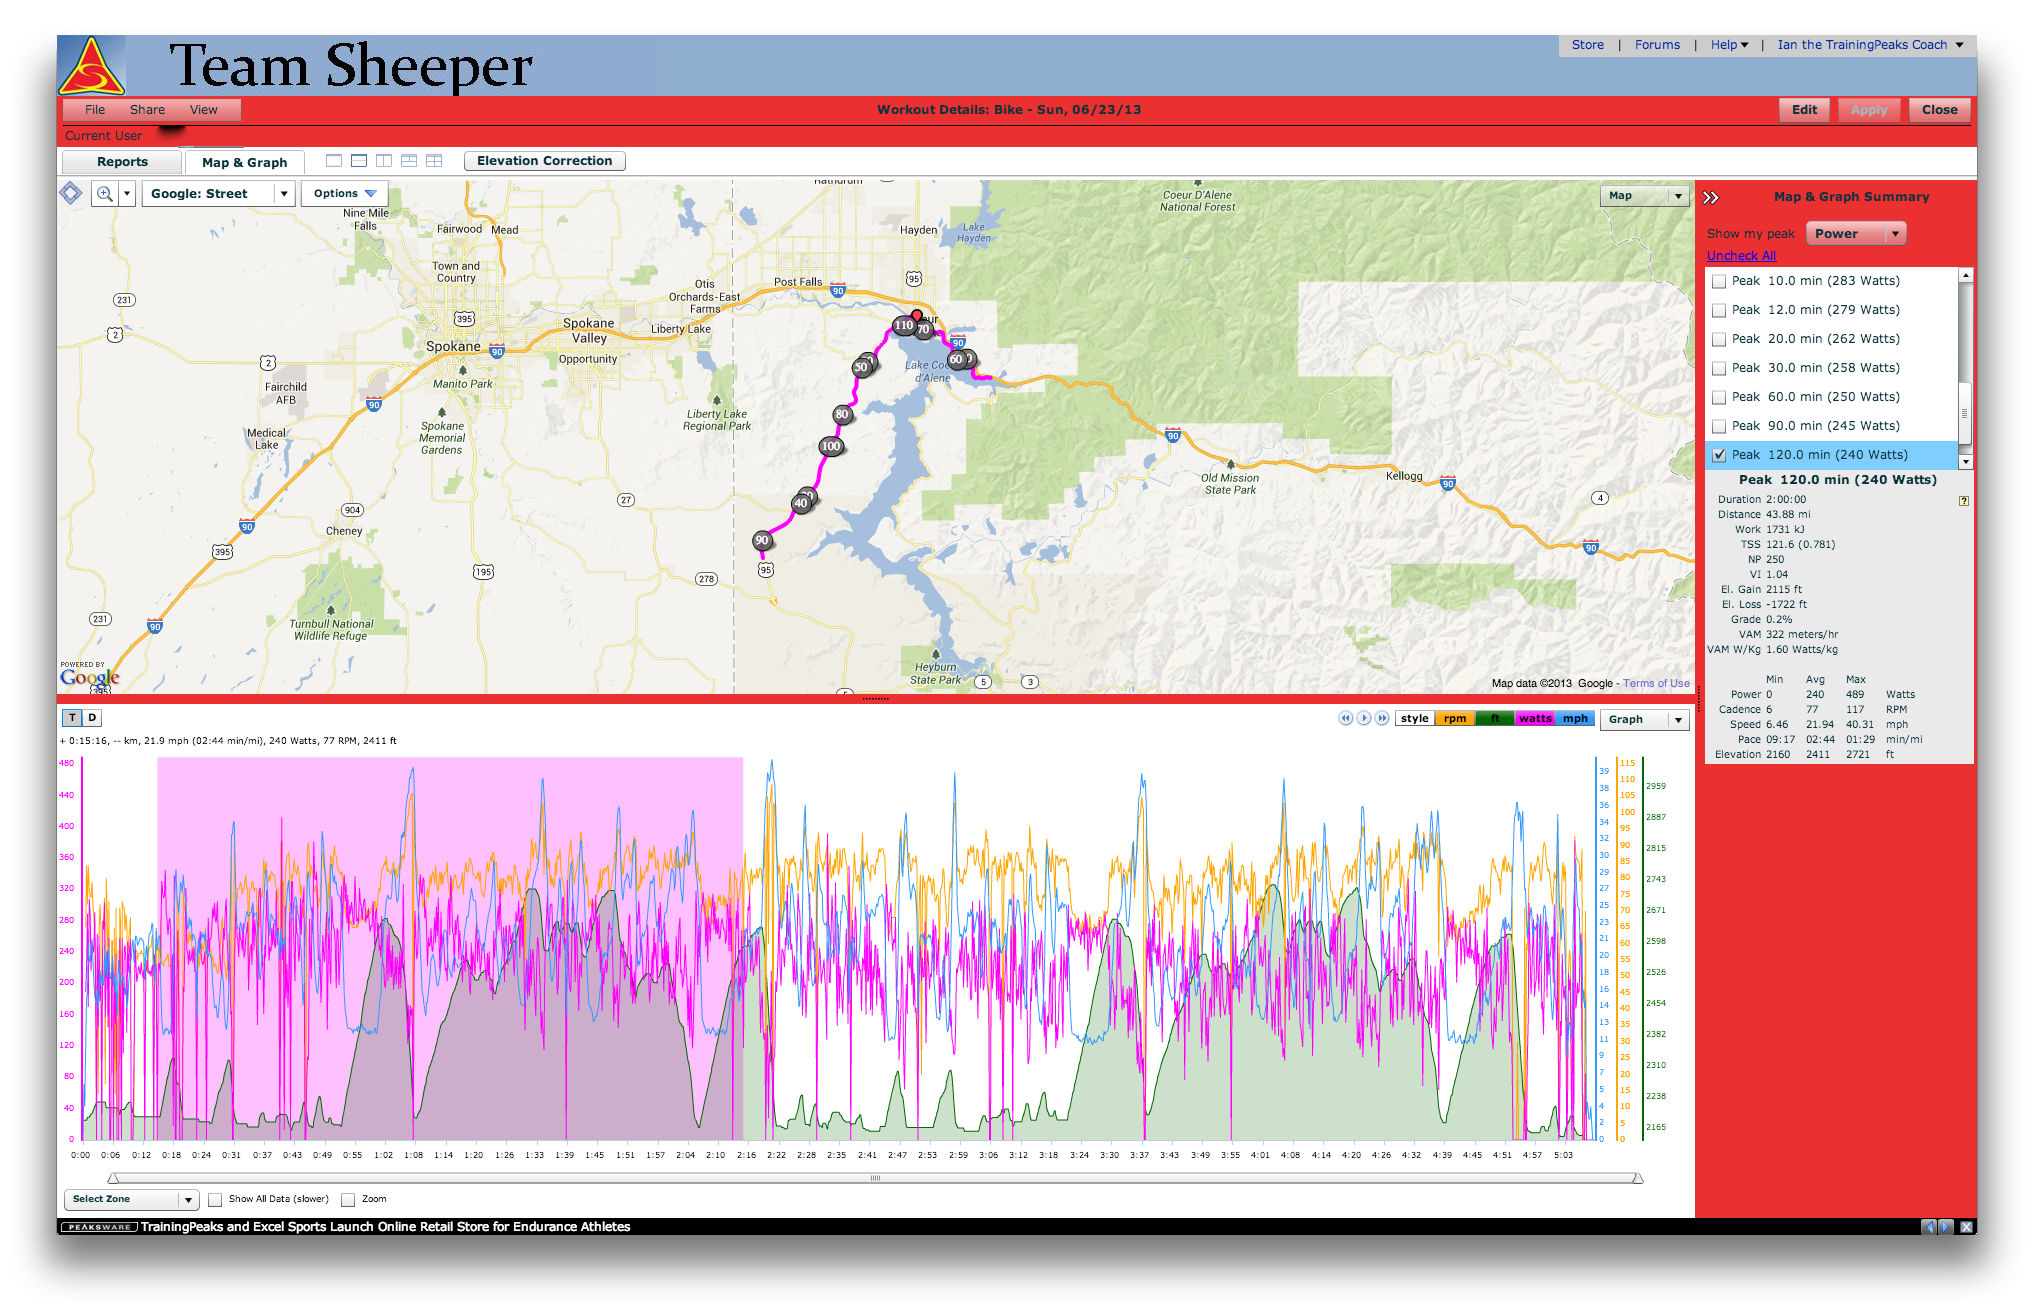
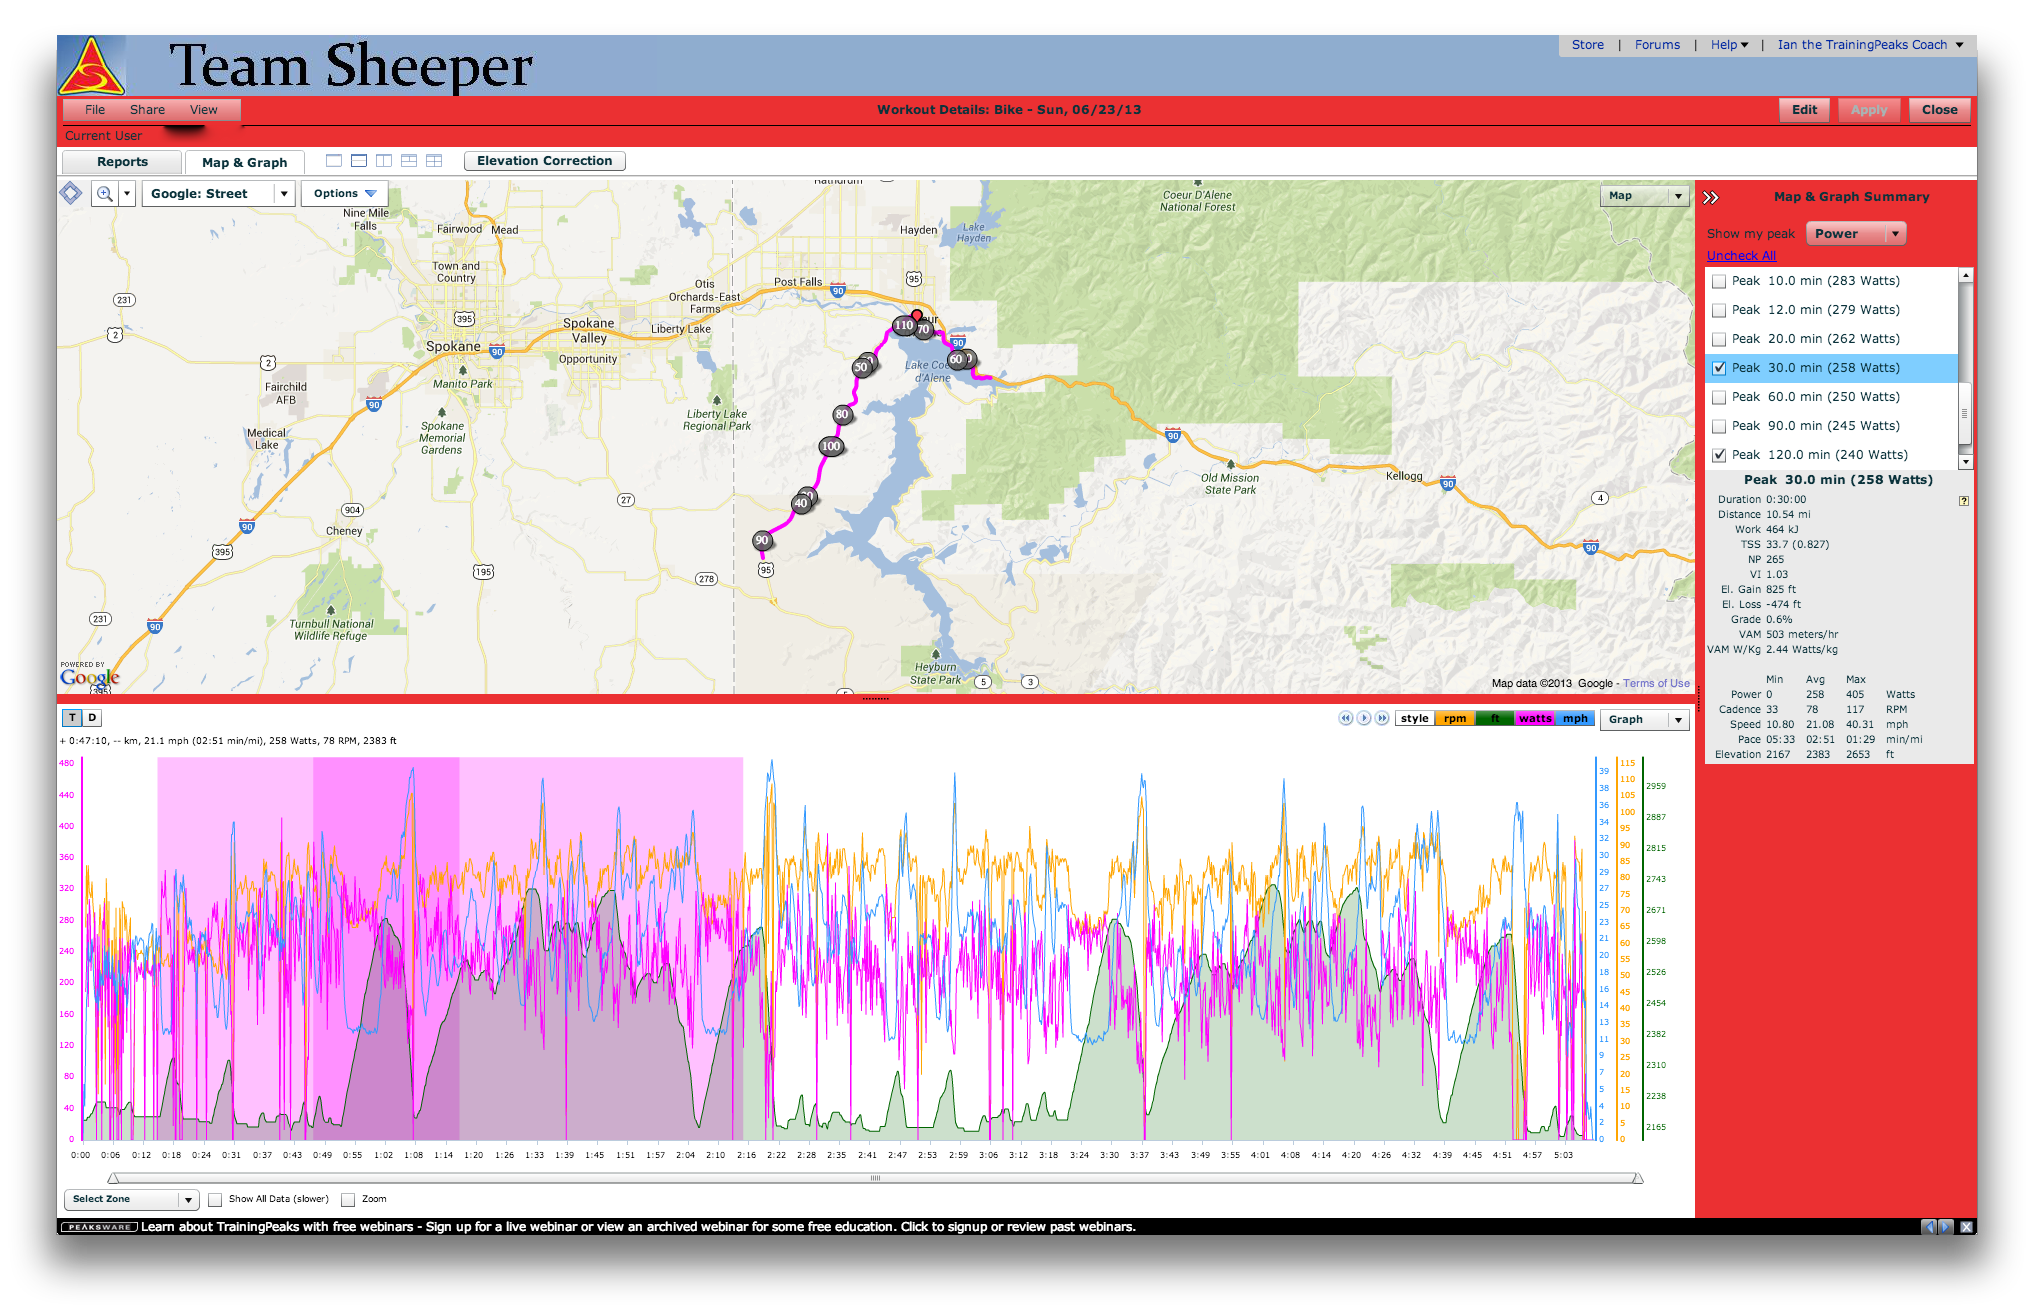
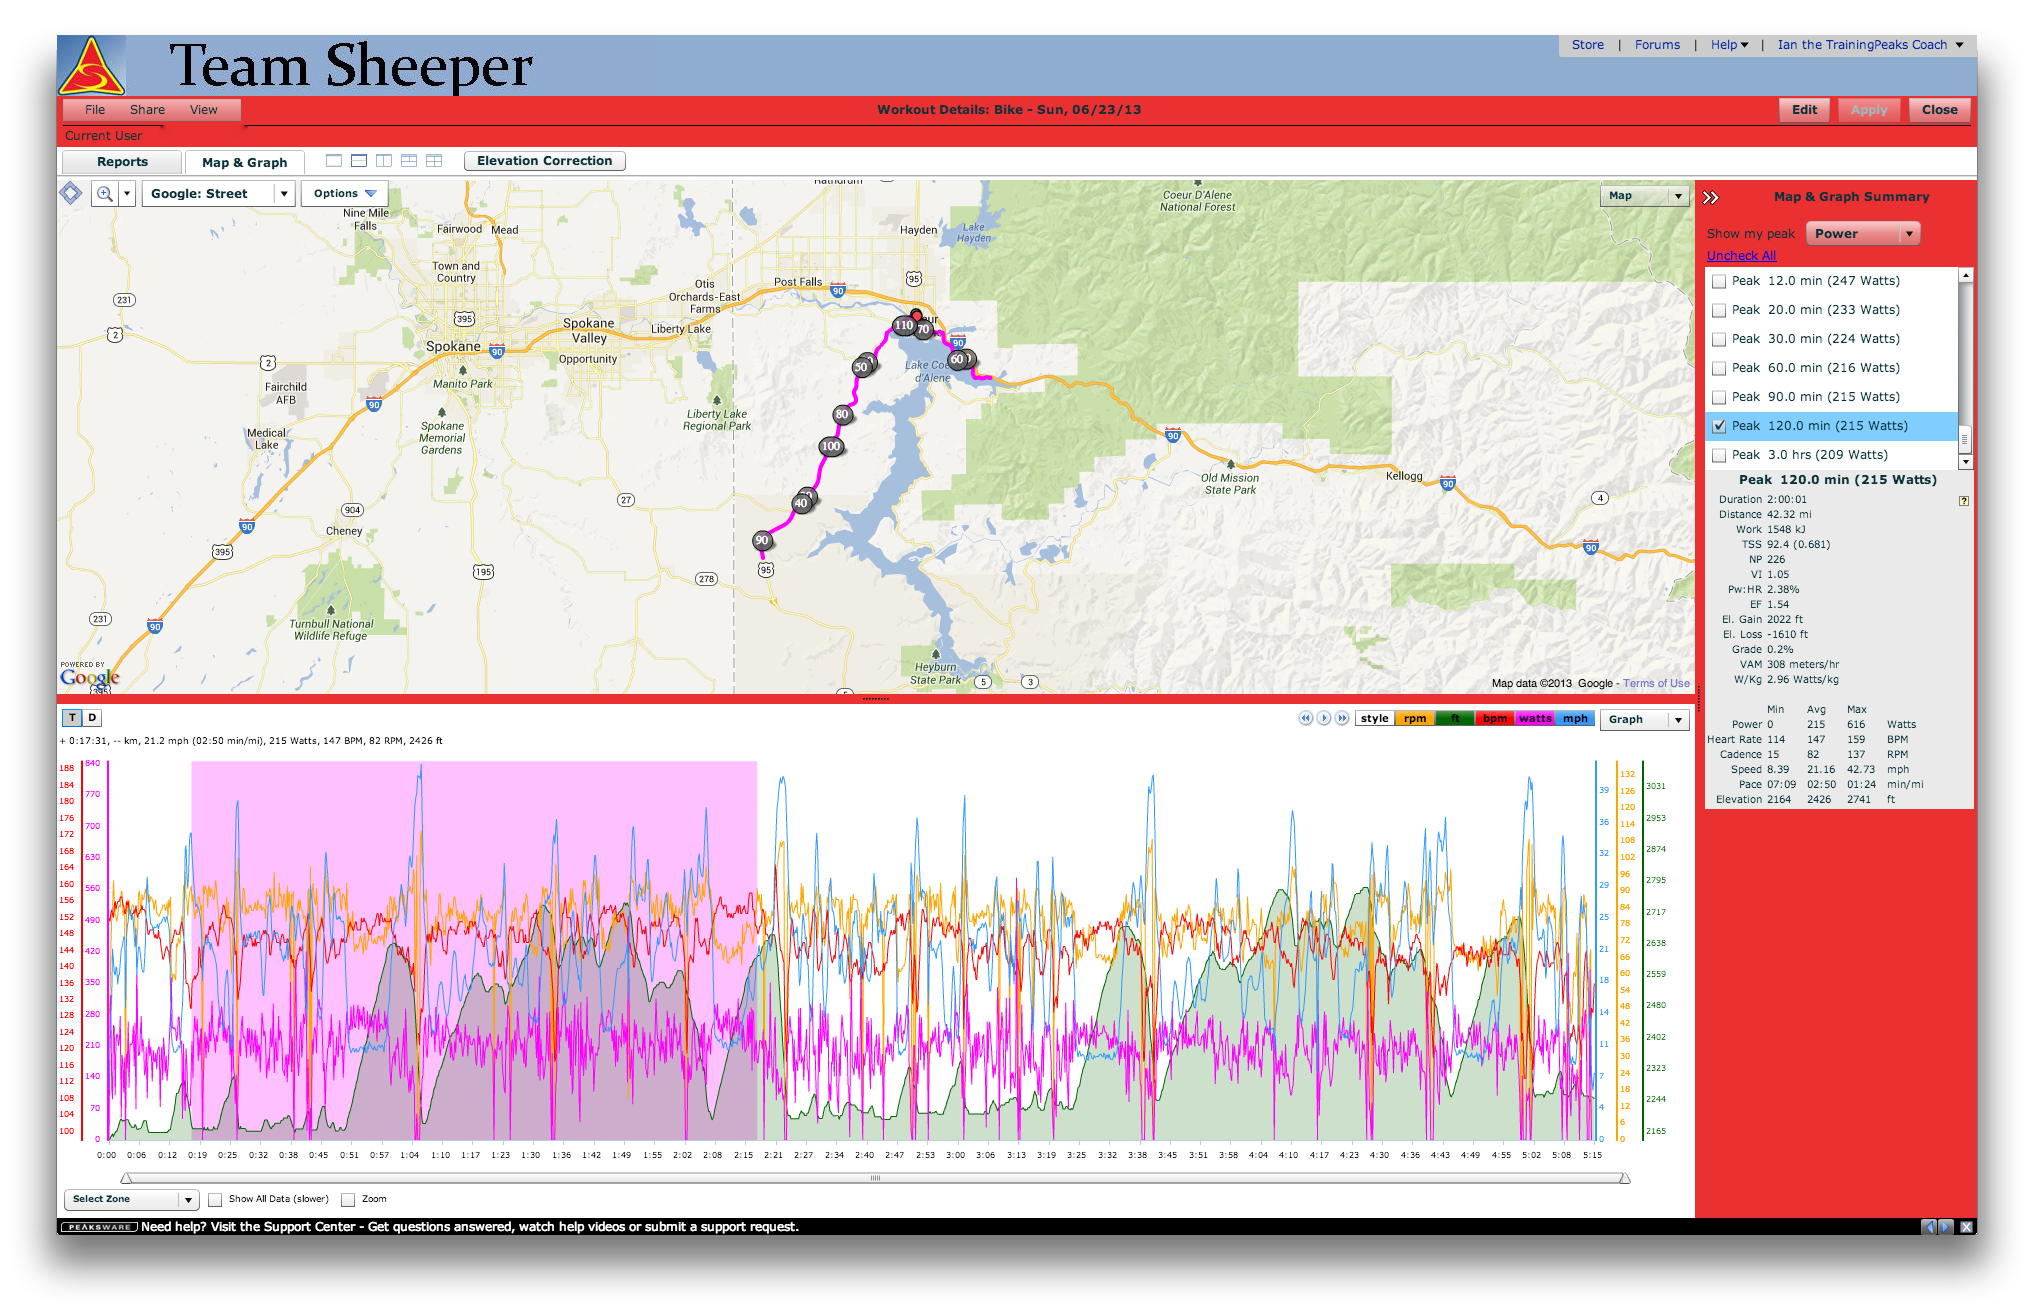
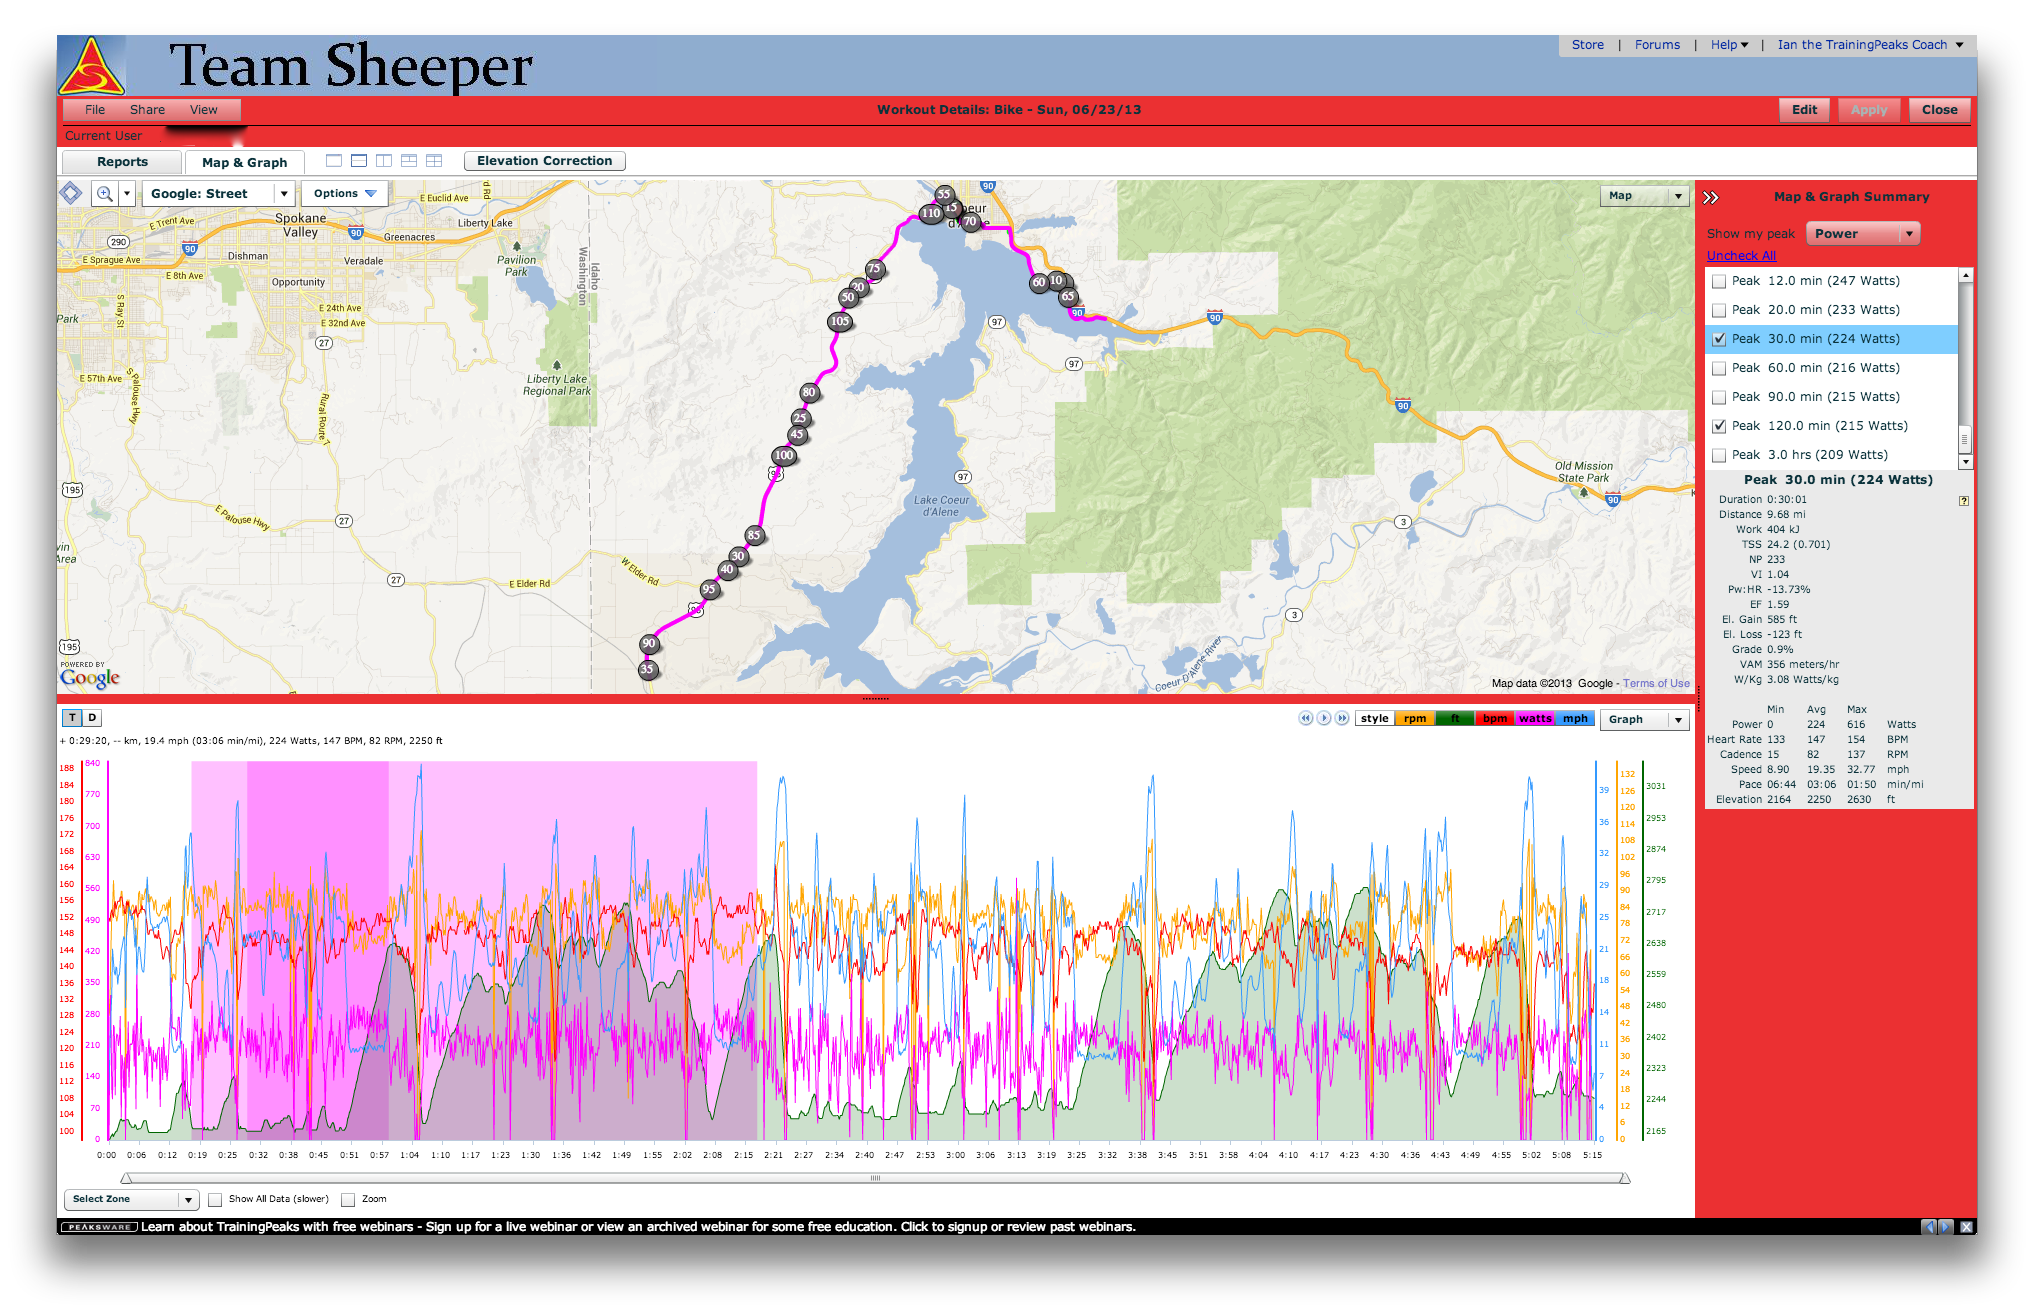
The great thing about looking at Coeur d’Alene is that it is a two-loop bike course, so we can compare his first and second halves to see if the effort was truly uniform. If we zero in on Peak 30 and Peak 120 (best power for 30 minutes and 120 minutes, respectively), we see that those both occurred in the first half:
Peak 120 shows an NP of 250 — much closer to the target 255. Note that the average cadence was 77 vs. 78 for the entire ride.
Peak 30 occurs within Peak 120, and it involves a sustained climb, so there’s a spike in power up to 265W for that period. The cadence for this segment also equals the average cadence for the entire ride, at 78 rpm.
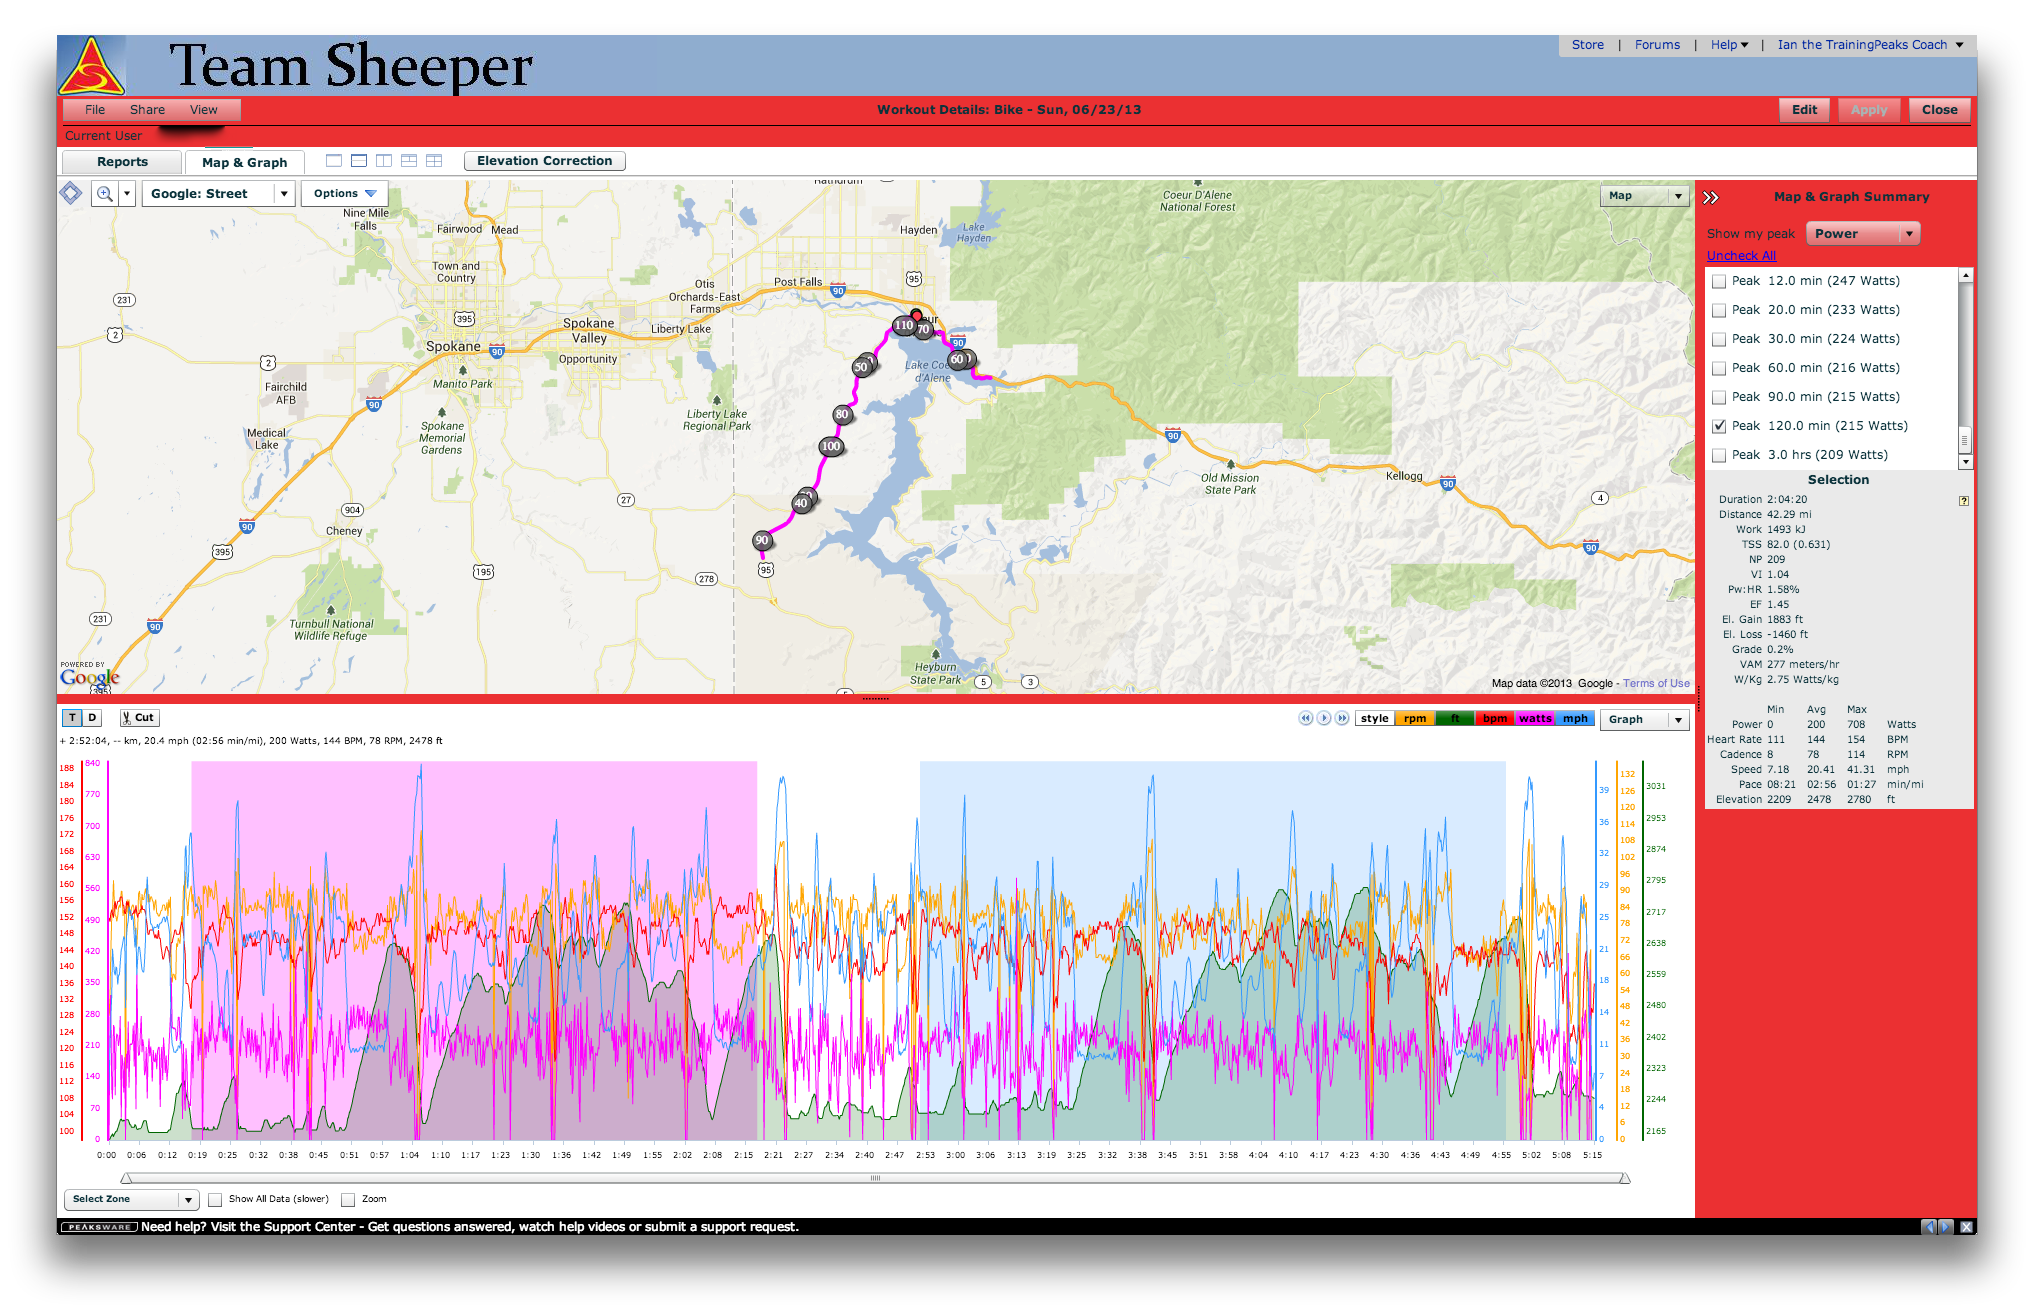
The timing mats had Athlete A doing the first half in 2:32:19 vs. a 2:35:04 for the second half, so there was a slight positive split. Lots of factors could account for this, though — a shift in the wind being the most likely external culprit. However, if we look at the same part of the course where the athlete did his Peak 120, we see a marked difference in power output:
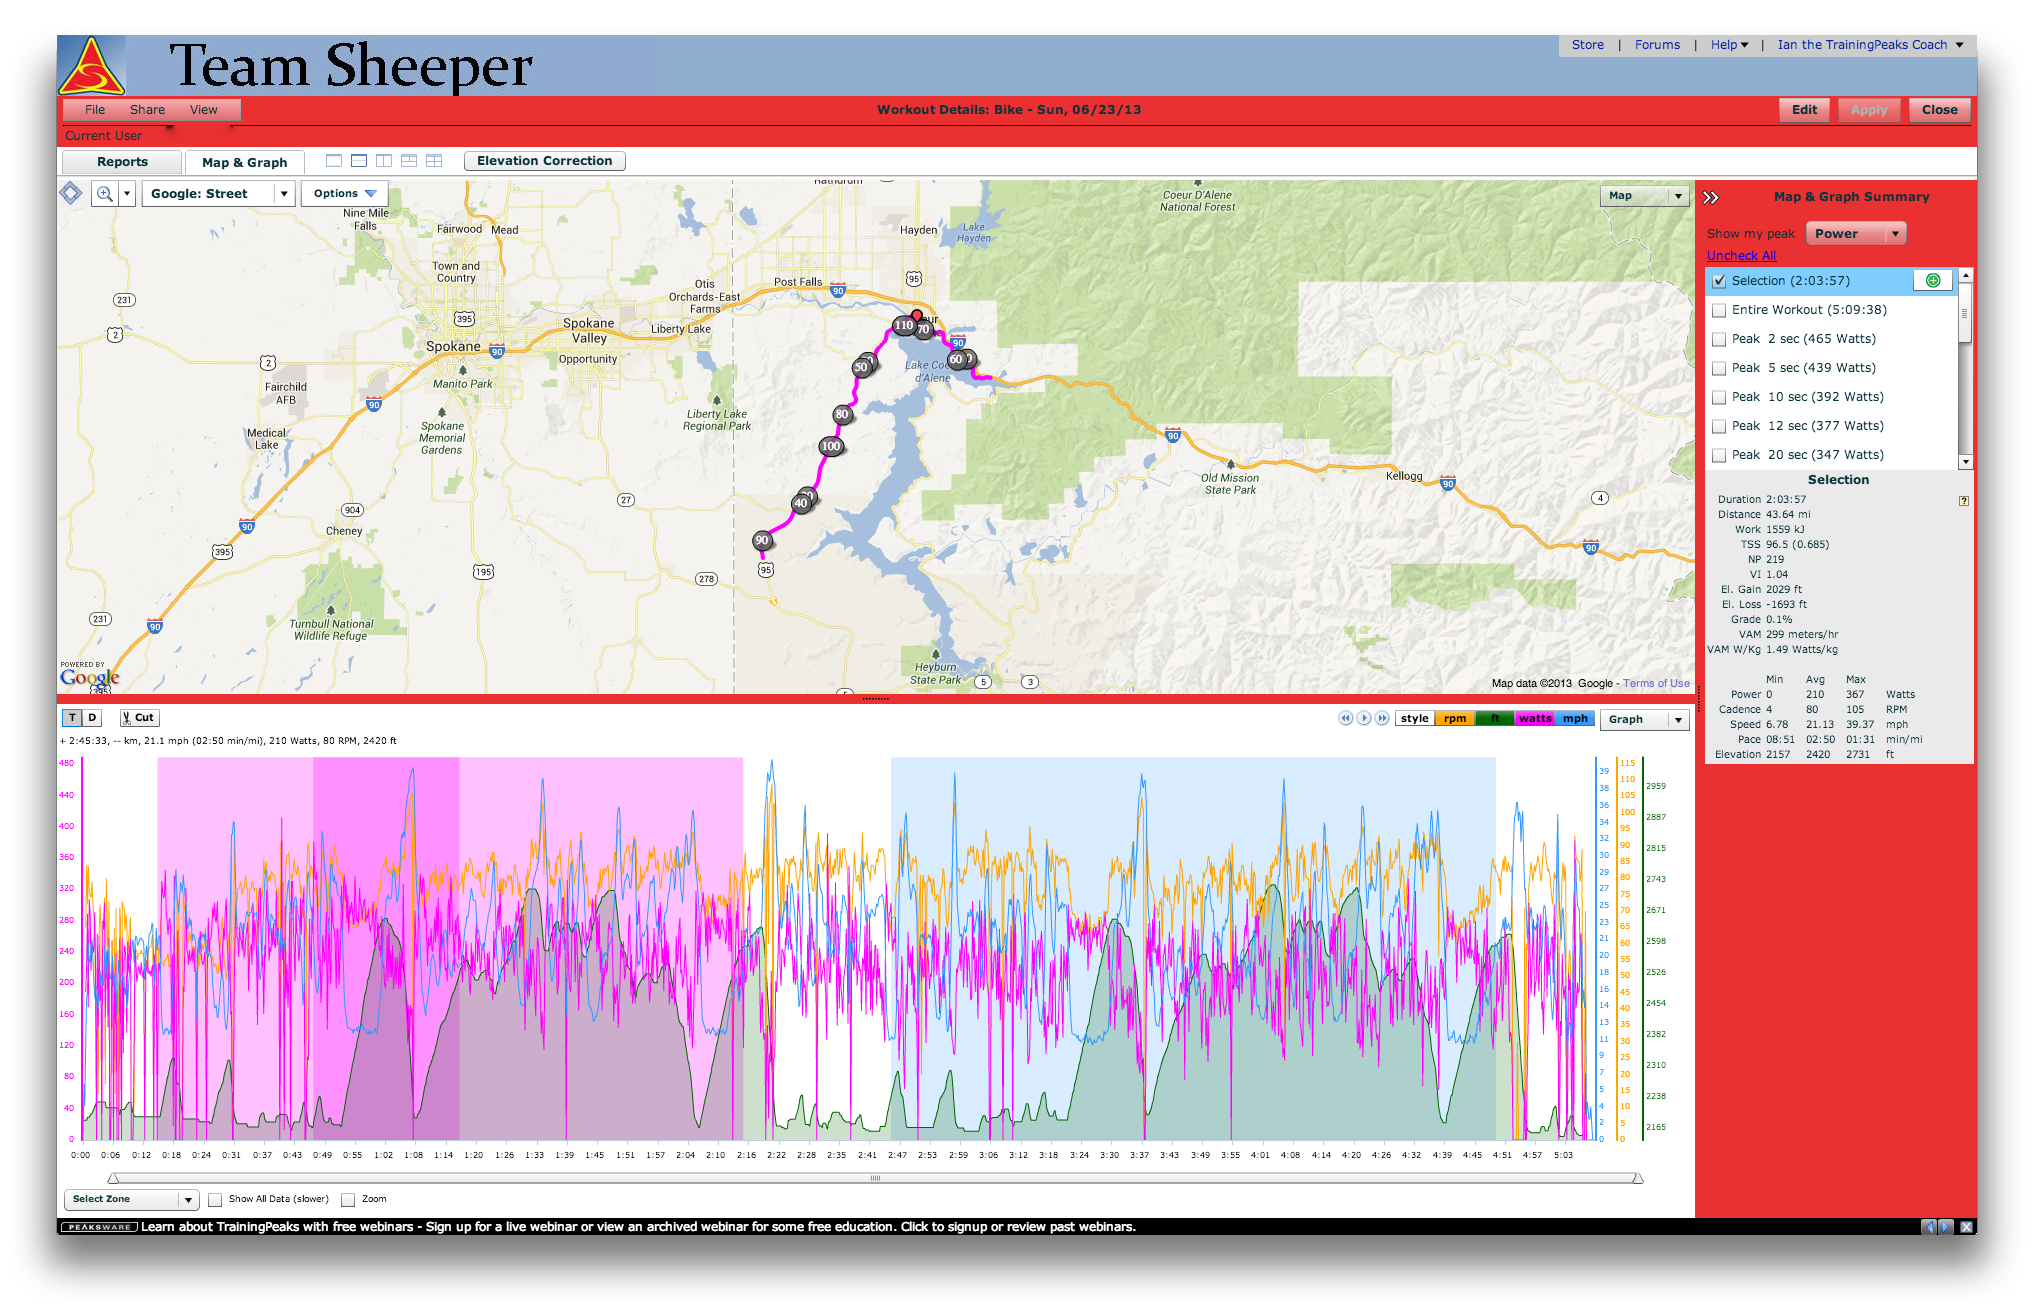
- NP of 219 vs 250 in the first half
- Average cadence actually went up from 78 to 80
- VI identical to that in Peak 120 at 1.04
Athlete A reported being aware that he was not comfortable pushing the same wattage in the second half, and the numbers would indicate that he likely backed off the gear but increased his turnover slightly. This strategy seemed to pay off, as he was able to run sub 3:30 off the bike for the first time in a decade, winning his age group by a massive 24 minutes. He used no watch or heart-rate monitor during the run; his major reported issue in that discipline were foot blisters he sustained early on and had to deal with for the bulk of the run.
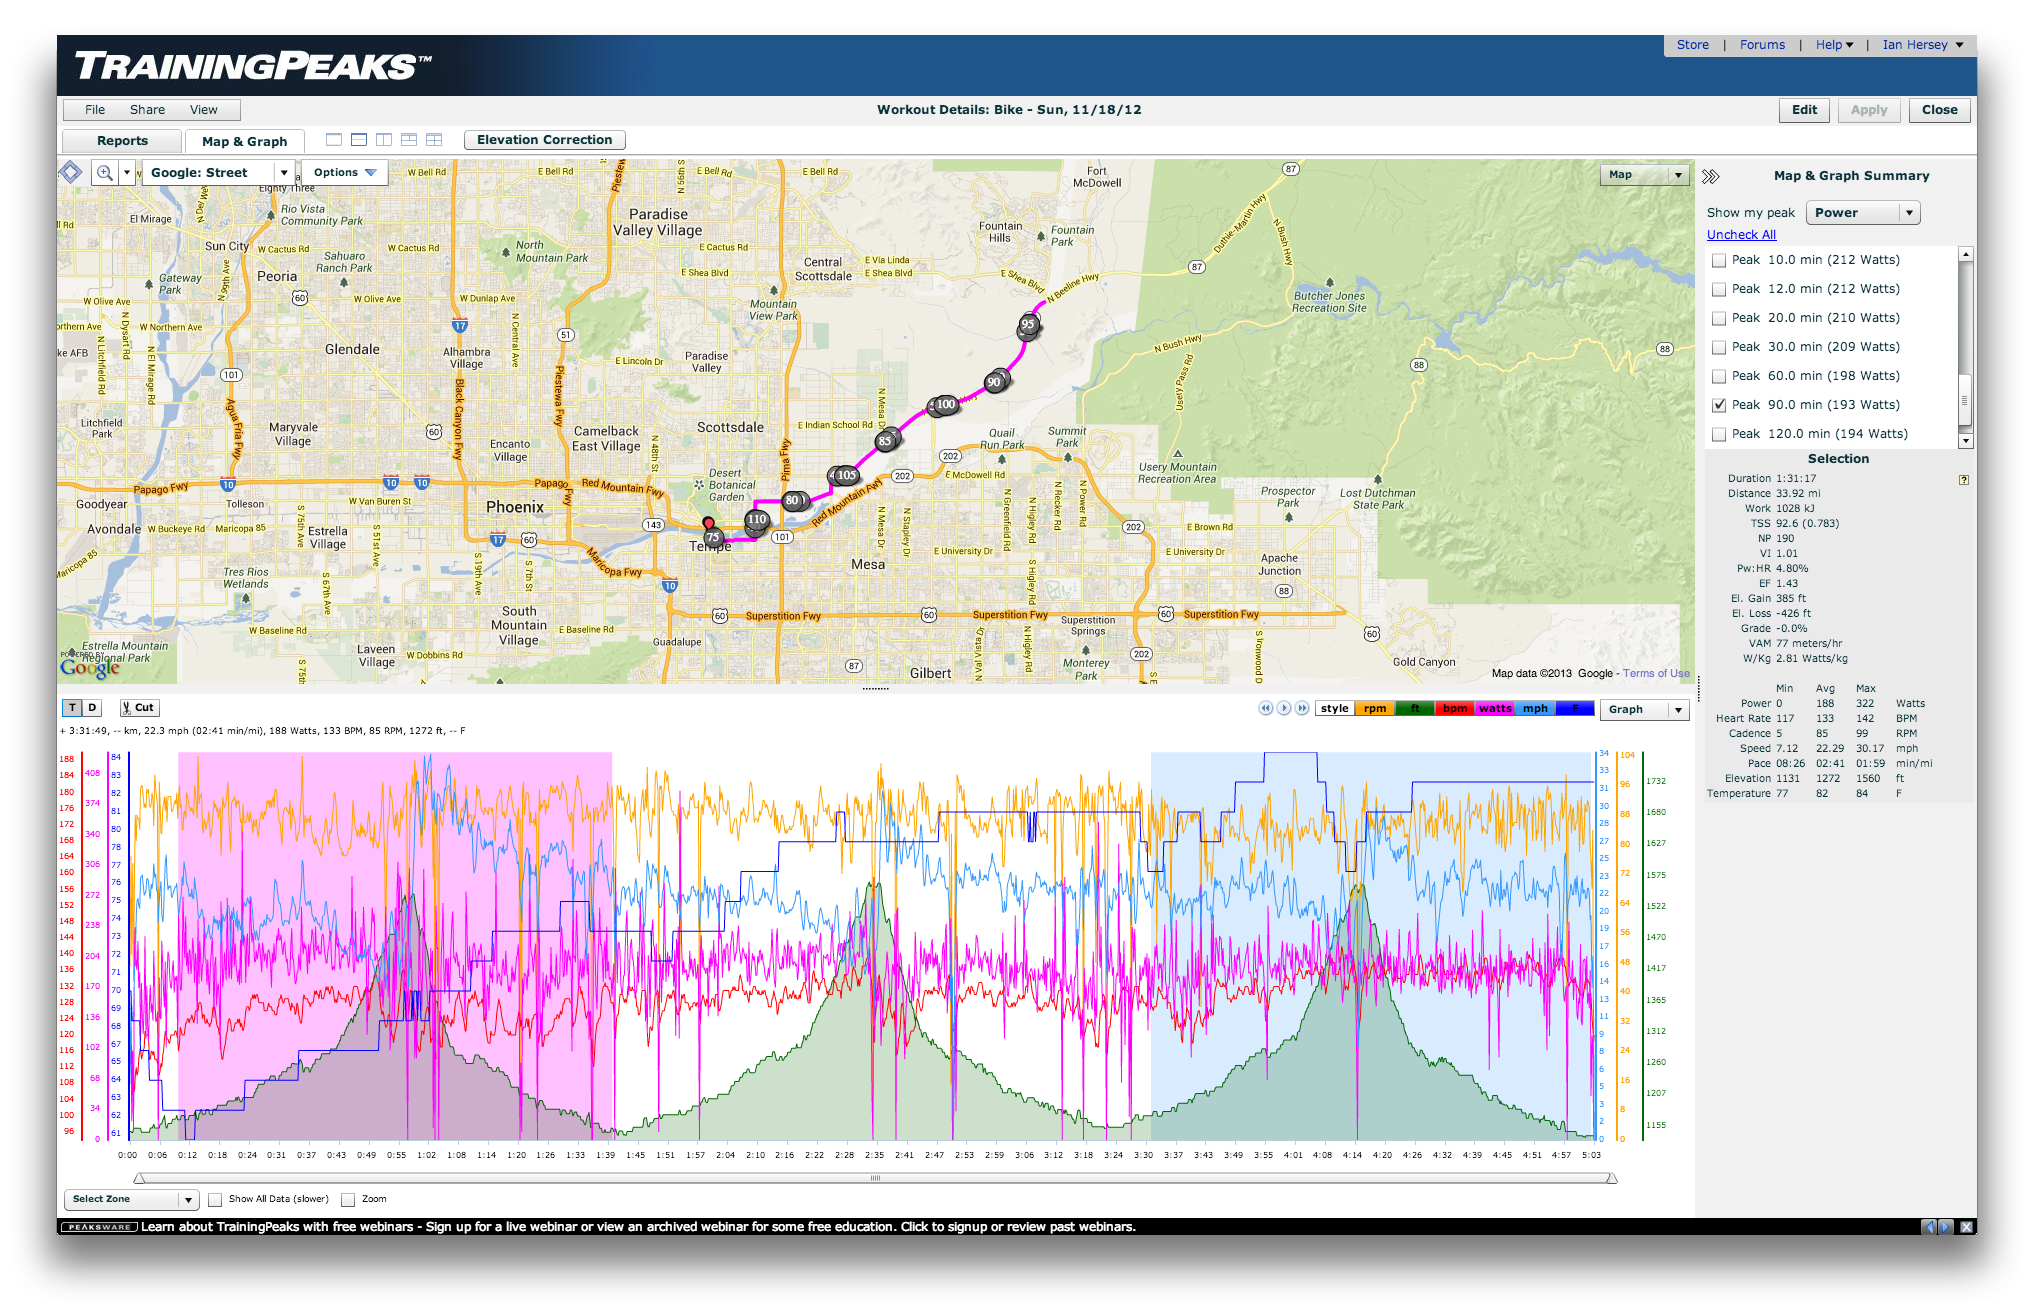
Athlete B put together a similarly strong race and reported feeling as though he could have gone a bit harder in the bike. If we look at his data, we can put some numbers to that perception:

- A TSS of 219 and IF of .65. This is very low indeed for a guy whose bike split is 5:14 on a hilly course.
- VI of 1.06, so ridden very consistently given the hills.
- Cadence averaged 80 rpm, 2 rpm higher than that of his elder teammate.
Athlete B reported feeling as though he were “holding back” the entire ride. If we look at the Peak 120 numbers, we do see a difference between the halves:
- NP of 226W, 11W higher than his average for the entire ride.
- Cadence of 82, or 2 rpm higher than his average for the entire ride.
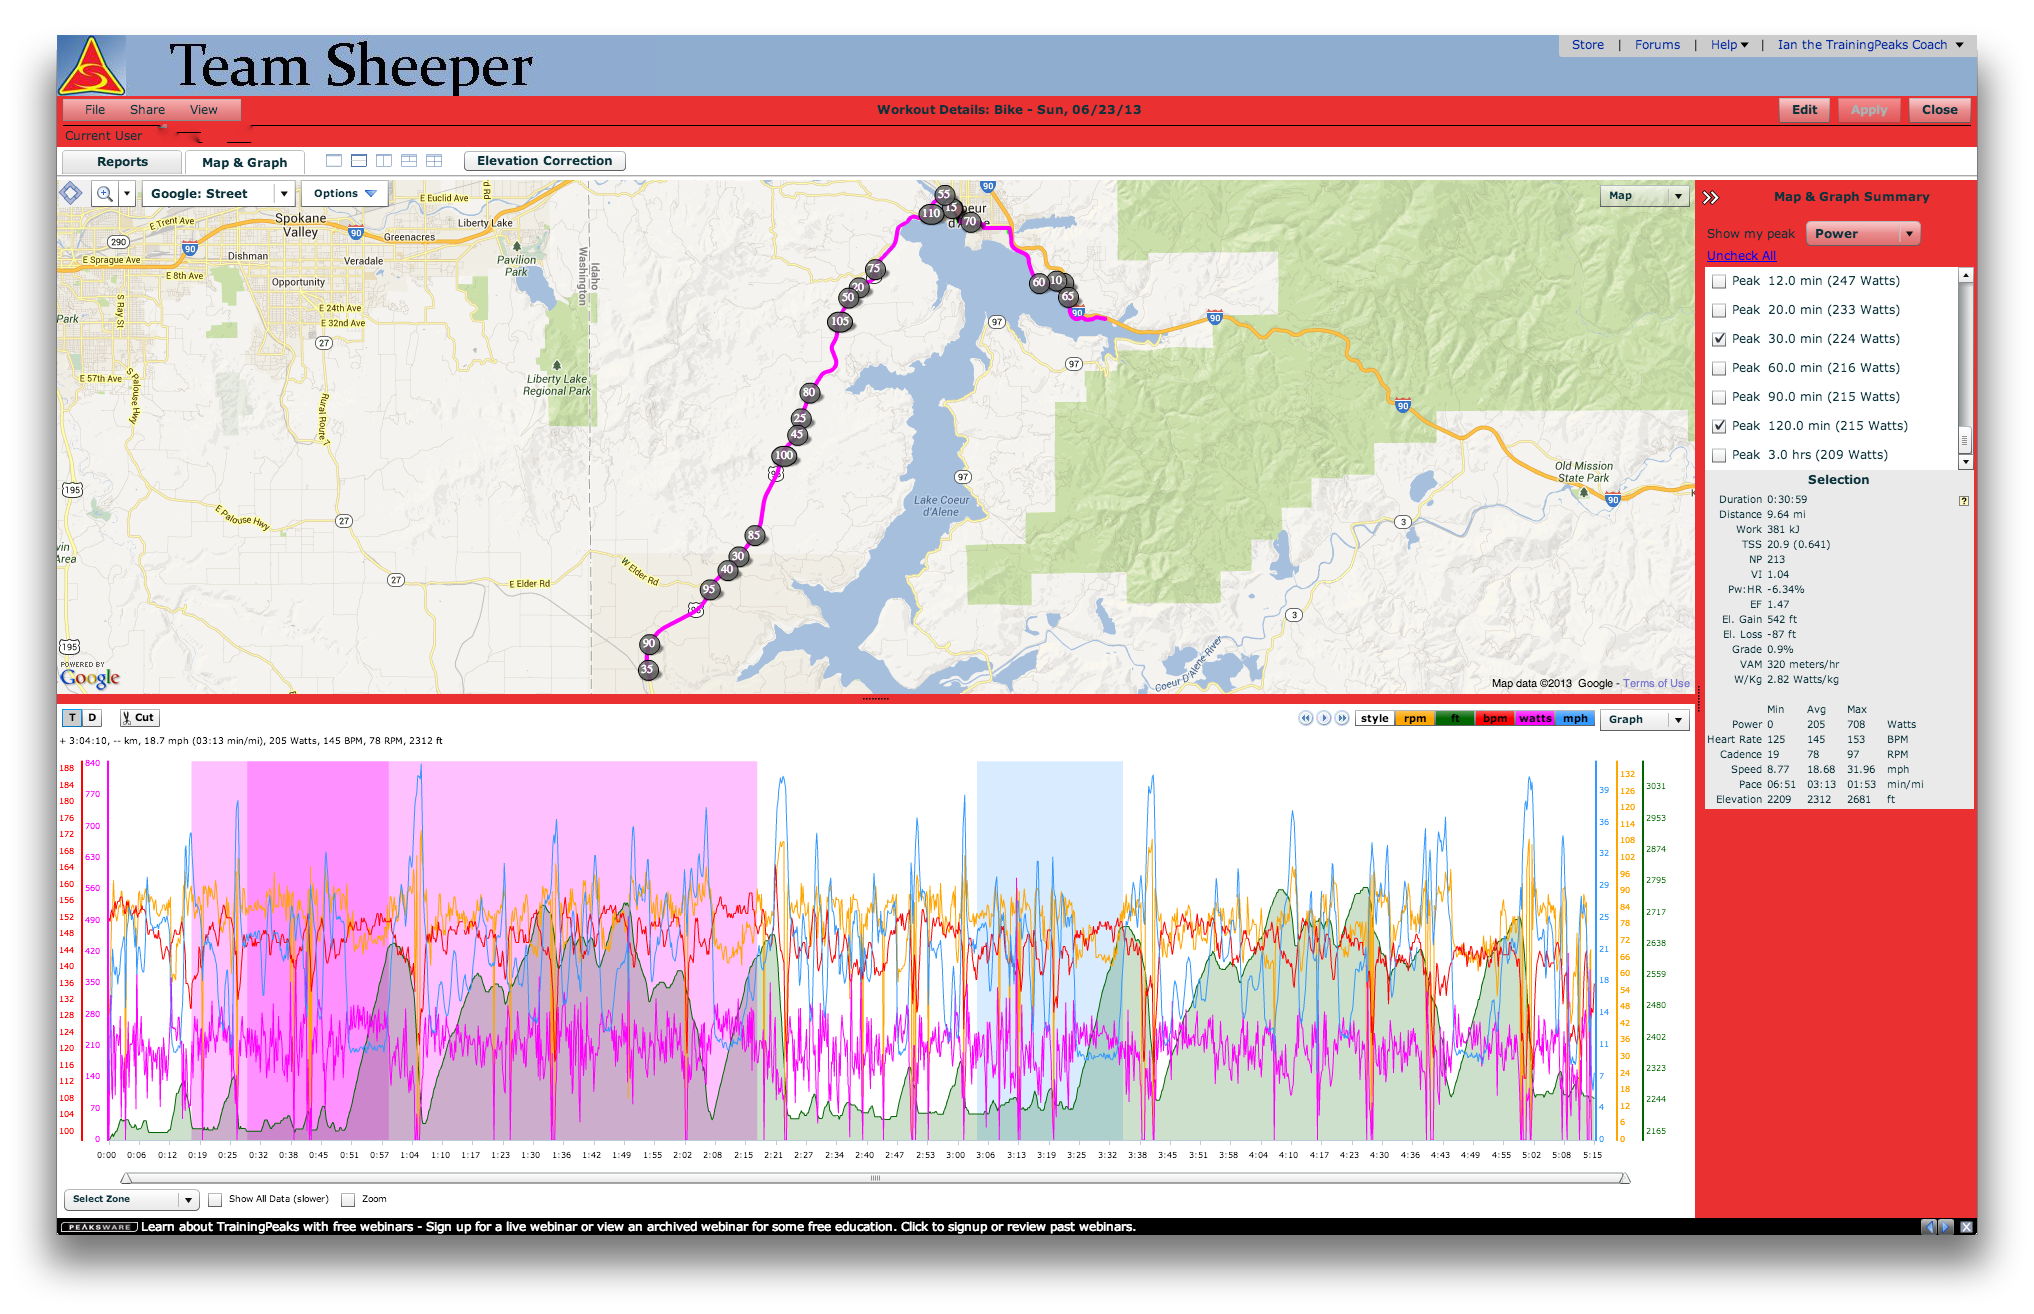
Peak 30 occurs at approximately the same segment as the Peak 30 of Athlete A:
Relative to Athlete A, Athlete B actually held back a little more in his Peak 30: he was 8% higher than his NP for the entire ride, whereas Athlete A was 14% higher than his NP during his Peak 30.
Yet we do see a similar fall-off, both in average speed and power, between the halves. The timing mats show a 2:35:09 first half vs. a 2:39:12 second half, and the power numbers do point to the cyclist’s own output as a significant factor. Looking at the same segment we had in Peak 120:
- NP of 209W, 17W (or 7.5%) lower than in Peak 120.
- Average cadence of 78 rpm, vs 82 in Peak 120.
What’s interesting is that this fall-off isn’t simply a “late in the ride” phenomenon; if it were, we would expect a significant drop in power after 90 miles. What we see instead, if we look at the Peak 30 segment during the second half, seems to be more of a conscious “holding back”:
- NP of 213W vs. 233W — 8.6% lower than in Peak 30.
- Average cadence of 78 rpm, vs 82 in Peak 30.
This suggests that Athlete B used similar gearing in the two halves but simply dialed back his cadence in the second half to keep the same RPE (Rate of Perceived Effort), whereas Athlete A actually increased his pedaling tempo in the second half but decreased his resistance. Athlete B, like Athlete A, did have a very good run split in the mid 3:20s, though it was about 10 minutes slower than he believed himself capable of.
A sample set of two athletes in one race obviously doesn’t hold up to any scientific standards by which one could draw any conclusions. Both athletes are very fit but do not put in the type of volume that professional Ironman triathletes do, but their type of training does correspond well with that of talented “recreational athletes” — those who don’t do it for a living. I believe there are several factors at play:
- Both athletes ultimately defaulted to RPE as an upper bound for their output. In other words, they maintained the same perceived effort. But natural fatigue and environmental factors (e.g., warmer temperatures as the day went on) increase RPE naturally, so the athletes had to reduce their output in order to keep their effort constant.
- We don’t have heart-rate data for Athlete A, but we do for B, and we actually see his average heart rate drop 3 bpm in the second half equivalent to his peak 120.
- Different athletes achieve “output relaxation” in different ways – some drop the cadence and some drop the gear. The fact that the more experienced athlete dropped the gear and increased his cadence is interesting, but we lack sufficient field data to draw any conclusions from that.
- What I believe this does suggest, though, is that “negative splitting” (increasing effort and output as the race goes on) must be done consciously and must be practiced in training. I’ve now seen many more power files from Athlete A, and this is a technique he has been practicing in his training rides as he prepares for Kona.
On a final note, I also looked at my own race from Ironman Arizona, which is a three-loop course, but one that is much flatter than Coeur d’Alene’s. If we look at Peak 90 (120 would be longer than the loops took me), we see:
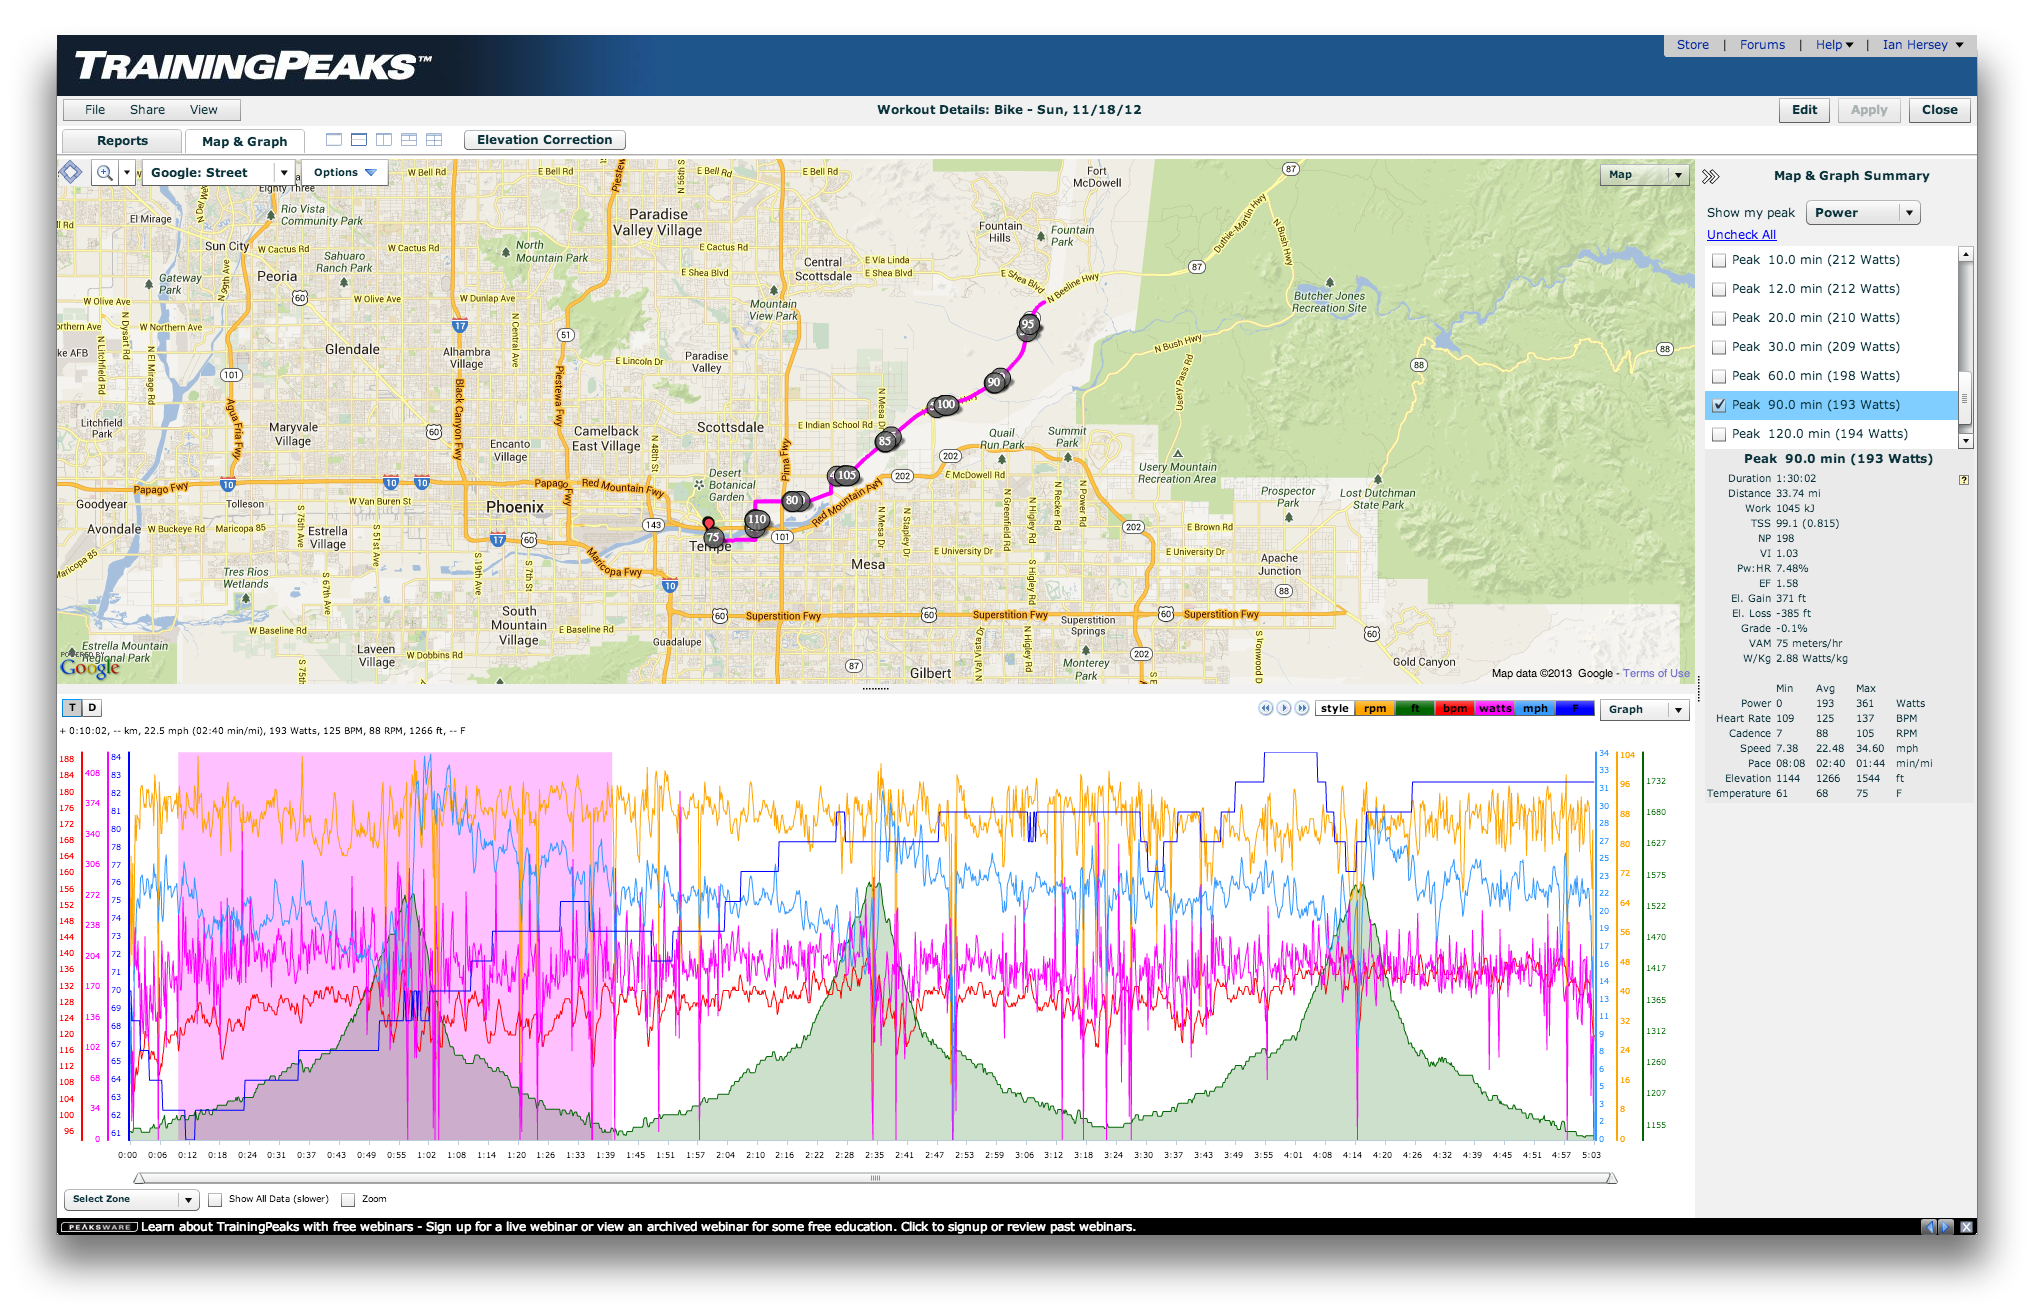
- Lower NP than either Athlete A or B by a lot. That’s because they are better riders. 🙂 But they also weigh 10% more than I do, and IMAZ being an easier course, I had a faster bike split (5:04).
- Higher average cadence than the IMCdA athletes. That might be a function of my coming from a running background, or might simply reflect the course differences between the two races.
Then if we look at the final third of the race, we see this:
- A drop of 8W in NP (from 198W down to 190W).
- A drop in average cadence from 88 to 85.
- Time loss of about 60 seconds.
- Surprisingly, superior VI (1.01 vs 1.03).
- Rise in average heart rate of 8 bpm (going from 125 bpm to 133).
I definitely recall making a conscious effort to work a little bit hard in the final third, but not by much, since I still had the run to go. Perhaps that is reflected in the rise in heart rate; more probably, though, the heart rate has to do with my high sweat rate and resulting dehydration (my training partners can attest to my “king of sweat rate” claim).
I’ve been making an effort to incorporate negative splits into my own Kona preparation as well. I did actually negative-split the Kona run back on a very hot day in the 2009 race, but the 3:56 run split was nothing to write home about. Due to the heat, I made the decision to approach the run from the outset in survival mode, which meant I walked every aid station from the first one on. With my sights set a little higher for this year’s race, a negative-split run will be a difficult feat to repeat.
